Best way to Explain Technical Analysis: LINK, HIVE, DOT, BAT, FLUX and APT
Technical Analysis, Bitcoin is on the approach of reaching $30,000 after a massive rise in buying volumes following the recent bank failures. This week’s review will look at the Web 3.0 coins to evaluate how they have performed!
LINK/USDT
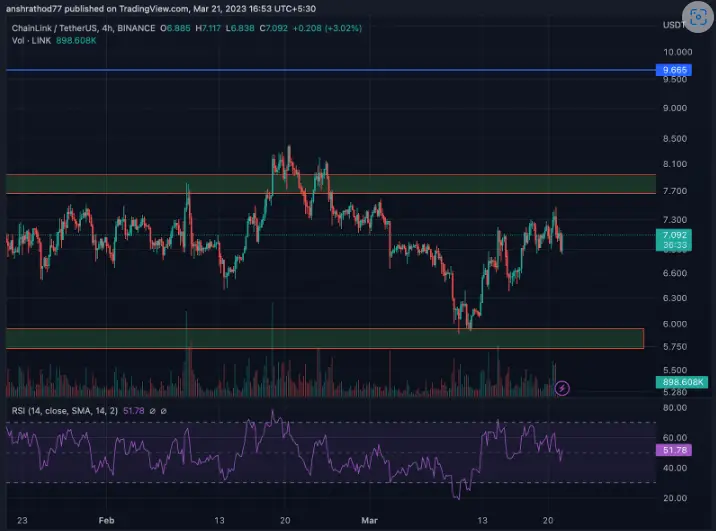
LINK has performed rather poorly because it is still trading in the same price range as in our prior research.
The price is currently approaching the $8 resistance level, which has historically been a zone of reversal. As a result, traders should wait until the resistance level is breached before anticipating any big bullish swings. After successfully breaking through the resistance level, the next supply zone at $9.65 becomes more visible. In contrast, if the price is rejected again, it is likely to fall back to $6.7.
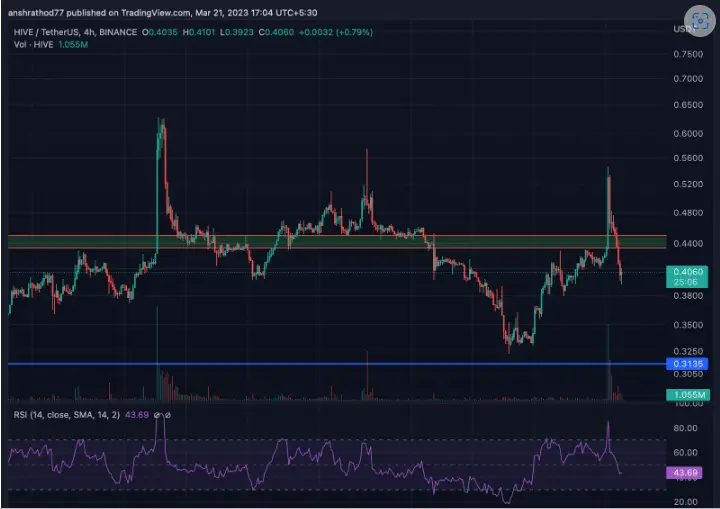
HIVE/USDT
HIVE fell below $0.31, but the bulls were quick to recover from the support zone, resulting in a rapid V-shaped comeback. HIVE must retake the $0.45 resistance level in order to continue its climb.
DOT/USDT
In our prior research, we overestimated the bears as DOT dropped to $5.2 after breaching the critical support level of $6 that we had identified. Soon after, a major reversal occurred, allowing the price to recover to $6.8.
The price is currently retesting the support level at $6.1 in the chart above. If this retest is successful, we can expect the trend to continue. (DYOR).

BAT/USDT
Recently BAT was on the verge of breaking through the supportive trendline, which is why we warned traders to be cautious.
Since then, BAT has dropped by more than 20% and has been one of the worst-performing coins. The bears will continue to dominate the bulls until the resistance at $0.26 is regained. The fact that Bitcoin is rising while BAT is falling should be cause for alarm for traders. As a result, traders should avoid BAT for the time being.