Best Way to Explain What Is Confluence and Why Is It Important in Crypto Trading?
Confluence is a geographical term that refers to the point where numerous rivers join into one. Confluence occurs in cryptocurrency trading when different methods or forms of analysis combine to form a trading strategy. Alternatively, when two or more indicators line up on a chart, it is referred to as a confluence of those indicators. In any instance, it occurs when two or more distinct concepts, indications, or techniques are combined to generate a trading idea.
Traders can act confidently when there is confluence. When numerous analysis methods tell you the same thing, your proposal has a better probability of succeeding. For example, when the RSI shows a bullish divergence on a stock with a highly healthy PE ratio.
You can be confident that a rebound is on the way in terms of finances.
Furthermore, confluence assists traders in reducing false signals. We know that indicators might provide false signals, but when combined with other types of analysis, you will be able to distinguish between the good and bad signals. After all, they are unlikely to have the same confluence as a good signal. In essence, seeking for confluence aids in reducing the number of false signals.
Fundamental Analysis and Technical Analysis
To forecast market direction, traders and investors rely on two basic tools: technical and fundamental research. Technical analysis is the study of price action history to forecast future direction, whereas fundamental analysis is concerned with understanding the market’s driving forces and applying this knowledge to forecast an asset’s performance.
Short-term traders prefer technical analysis, but long-term investors choose a more fundamental approach. Nonetheless, a combination of the two can lead to high confidence. For example, if an investor wants to buy a stock based on fundamental analysis, he can use technical levels to determine the best entry points. This convergence enables the investor to further optimize his trade, increasing his gain relative to risk.
Technical Analysis in Confluence Trading
Many traders base their trading decisions on price activity and utilize trading indicators to provide confidence to their trading technique. With so many price action concepts and trading indicators to select from, this convergence can take numerous forms. Let’s have a look at how confluence works on a graph.
Price Action Trading Confluence
First and foremost, price action ideas such as support and resistance, chart patterns, market structure, trendlines, candlesticks, and Fibonacci are frequently used as the foundation of a stock, cryptocurrency, or FX trading strategy.
Let’s take a look at the chart below, which shows the most recent Bitcoin price action. The chart depicts a trendline, support and resistance levels, a Fibonacci retracement level, and two locations of high confluence.
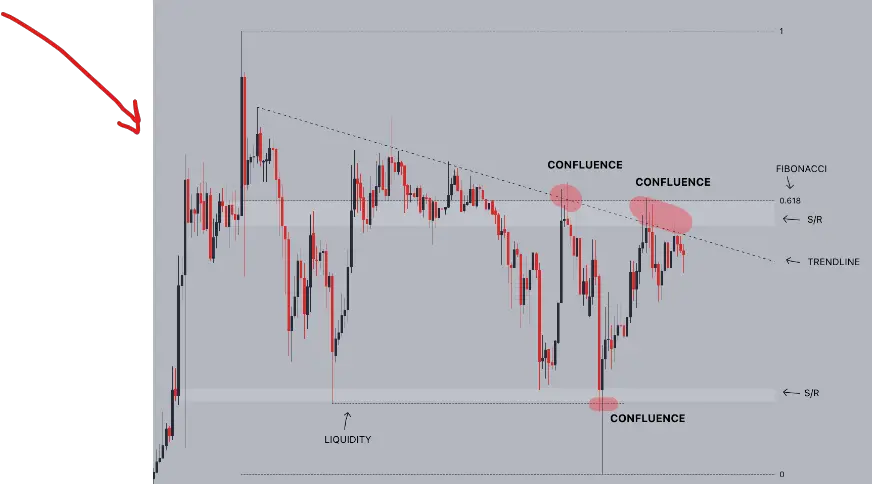
Trading at the Support Level Confluence
The support level confluence is one of the most common types of confluence in technical analysis. Following the identification of a support level, traders can seek convergence with other types of analysis. As shown in the example, the support level corresponds to a previous liquidity pocket. When the price reached that confluence zone, it experienced a significant bounce.
Trading at Resistance Level Confluence
Resistance levels are frequently used in conjunction with other instruments. In this case, the resistance region coincides with the trendline (a sell signal), resulting in a sell-off into the support and liquidity area.
Trading at Fibonacci Level Confluence
The resistance level gained an additional degree of confluence following the bounce from the liquidity pocket. The golden pocket (0.618) matches up nicely with the S/R area when the Fibonacci retracements are drawn from high to low. This new confluence increased traders’ conviction to sell, resulting in two further rejections from the resistance level.
Trading Trendline Confluence
Finally, as demonstrated in the preceding example, trendlines are an essential component of confluence. Whatever method you use for analysis, having a trendline that adds to your idea never hurts.
Technical Indicators for Trading Confluence
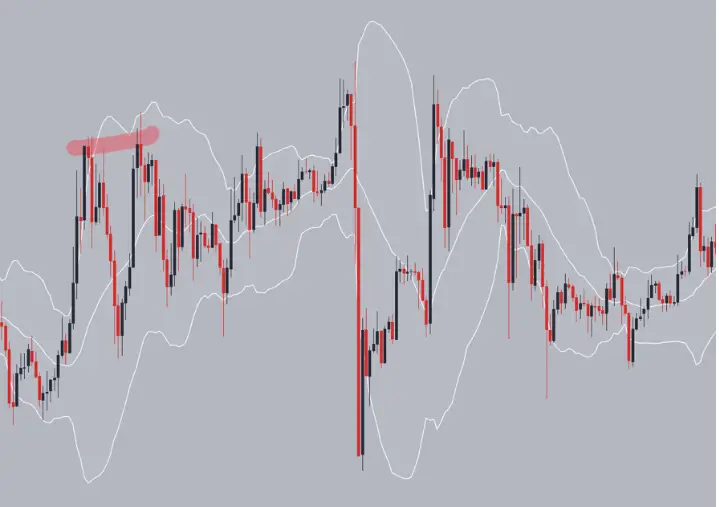
Combining multiple technical indicators, such as a moving average, an oscillator, and Bollinger bands, is another way to look for confluence. The price motion of Bitcoin is paired with Bollinger Bands and the RSI in the sample below. Because both the RSI and the Bollinger Bands indicate that the price is overbought, the area highlighted in red shows confluence.
The bearish divergence adds to the idea’s confluence. All things considered, this suggests a possible reversal and the beginning of a decline.
Trading Confluence Through the Use of Technical Indicators and Price Action
When we combine indications with price activity, we get a superior confluence. The chart below depicts the same price movement as before, but with Bollinger bands and RSI added. As you can see, these signs add to the already indicated degrees of confluence. Traders can trade with confidence and avoid false signals by combining these many types of analysis.
How Much Confluence in Trading Is Enough?
The question then becomes, how much convergence is enough? Traders should test their strategies in order to develop a successful trading or investing approach. Experiment with several strategies to find which combinations produce the most consistent results.
Using more indications is not always preferable, as it can rapidly become overpowering. Analysis paralysis can occur when too many indicators are used. Successful traders, in our experience, combine price movement research with one or two indicators and work with them.
Final Thoughts
Overall, trading is a very difficult skill to master. Confluence can mean the difference between a profitable plan and a losing strategy.
Overall, confluence is an important trading concept to understand and master. It allows traders to take higher-probability bets while decreasing the likelihood of false signals. It is applicable to any time range, whether day trading or swing trading.
In any case, even with perfect convergence, trading remains a game of probabilities rather than certainties. Always keep this in mind and practice effective risk management to prevent yourself from significant losses.
Write more, thats all I have to say. Literally, it
seems as though you relied on the video to make your point.
You obviously know what youre talking about, why waste your intelligence on just posting videos to your blog when you could be giving us
something enlightening to read?
thank you for your time also we will take in consideration what you suggest, once again thank you